Genotype-phenotype variability of thalassemia: Thero-diagnostics investigation:
-
Hematopoietic Stem Cell-based Maturation and Drug Development: The clinical severity of Thalassemia hinges on the extent of ineffective erythropoiesis, caused by the delayed maturation of erythroblasts. Research reveals that the bone marrow of beta thalassemia patients harbors 5-6 times more erythroid precursors than that of healthy individuals, with accelerated apoptosis and impaired maturation. In an exhilarating breakthrough, the team has pioneered the ex vivo maturation of RBCs from PBMCs, enriched with HSCs. Now, they are screening various compounds to enhance RBC maturation from PBMCs collected from Thalassemia patients, aiming to identify promising drug candidates for Thalassemia treatment. This cutting-edge project leverages autogenic stem cell development to discover new pharmacologic compounds, marking a bold step forward in the quest for a Thalassemia cure.
-
Integrated Transcriptomics and Proteomics Investigation of Thalassemia Clinical Heterogeneity: This area of research delves into the intriguing phenotypic differences among Thalassemia patients who share identical compound heterozygous mutations in the HBB gene, comparing those with severe and non-severe profiles. By analyzing the transcriptome and validating findings through the proteome of red blood cells (RBCs), this study is crucial in uncovering key dysregulated molecular pathways in the RBCs of Thalassemia patients. The insights gained offer exciting new targets for drug development, paving the way for innovative treatments and improved patient outcomes.
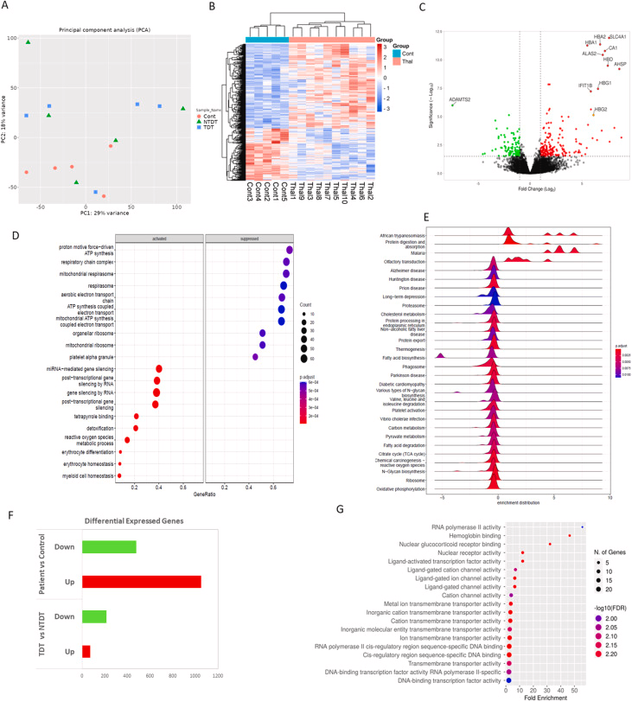
Figure: PBMC transcriptome data analysis. A) PCA plot showing 29 % and 18 % variation among patient (TDT and NTDT) and control groups., B) Heatmap showing the expression of significantly differentially expressed genes between control and thalassemia groups. C) Volcano plot showing upregulated and downregulated genes in the thalassemia group (p-value <0.05, log2FC > 1 or < -1). D) Gene Ontology Biological Process (GOBP) analysis showing enriched bioprocesses that are activated or suppressed in thalassemia., E) Ridge plot showing the overall distribution of expression data for KEGG pathways. F) Bar graph representing the number of dysregulated genes obtained through transcriptome analysis: patient vs control, TDT vs NTDT. G) Gene Ontology Molecular Function (GOMF) enrichment analysis of dysregulated genes in TDT compared to NTDT.
Mitra N, Chowdhury P, Basu A. Exploring the functional and immune landscape of E-β thalassemia patients through RNA sequencing of peripheral blood mononuclear cells. Heliyon. 2024;11(1):e41255. Published 2024 Dec 14. doi:10.1016/j.heliyon.2024.e41255.
3. Development of genetic diagnostic algorithm Indian population and searching of modifier loci: [A multicentric project on Thalassemia genomics, funded by DBT , Govt of India, participated by PGIMER, Chandigarh, Institute of Child Health (ICH), Kolkata, Burdwan Medical College and Burdwan University]. A comprehensive Thalassemia diagnosis solution has been developed involving both SNVs and CNVs of HBB gene cluster and HB alpha genes and also modifier genes. An NGS based target panel has been development of genetic diagnostic algorithm for Indian population and searching of modifier loci, through Whole Exome Sequence (WES) and Targeted sequence of the HBB gene cluster.

Figure: Depth plot analysis, variant mapping and IGV validation of identified deletions in the beta-globin gene cluster. Each upper panel represents depth plot analysis, and each lower panel represents the IGV view of the BAM file with coverage. The region of deletions is marked in the red box, whereas stretches of homozygous variants are indicated with black outlines A. Representative plot of heterozygous deletions encompassing the HBD–HBB genomic region (S7, S13). B. Compound heterozygous deletion of HBD–HBB and HBE1–HBB. The common region of deletion with complete loss of sequence reads is indicated in the red dotted box, (S12) C. Heterozygous deletion from HBBP1–HBB, (S8). D. Genomic deletion from HBG1–HBB (S9, S14). E. Representative plot of the entire target region deletion (S4, S10, S11). F. Representative plot of a control subject; homozygous and heterozygous variants are distributed throughout the entire target region.
Pal, D., Chowdhury, P.K., Nayek, K. et al. A next-generation sequencing-based universal target panel and algorithm for one-stop detection of copy number alterations and single-nucleotide variations in the HBB gene cluster for rapid diagnosis of β-thalassemia. Mol Biol Rep 52, 128 (2025). https://doi.org/10.1007/s11033-024-10196-2.
4. Development of field-based thalassemia carrier screening kit and protype ready for Technology transfer to Industry: This is user-friendly ready-to-use field based haemoglobinopathy/Thalassemia carrier screening kit. Result can be understood by visual observation or Mobile App. [This was funded by DBT -BIRAC, Govt of India. and Indian Patent has been submitted: [Filing dated: 18/08/20; Published at The Patent Office Journal No. 08/2022 Dated 25/02/2022; page no. 11743].
5. HbF inducing Drug repurposing for Thalassemia treatment : Recently, group has showed that HbE/β thalassemia with γGglobin-158 C/T [HBG2 c.-211 C>T ; NC_ 000011.9: ] polymorphism may be treated with hydroxy urea and can lower the need of blood transfusion (Published 2021,).
CLINVAR SUBMISSION: